To have a good monitoring solution is essential for managing availability at enterprise level. So many organizations start with open source technology to visualize parameters. Grafana is used often and there are many complementing software pieces, which together create a mature environment. This tends even to influence the security management as well. A customer required us to integrate the CIS benchmarks into the existing grafana dashboards.
For step 1 we ended up with the CIS Assessor installed and with the dashboard which can be used to show the results and download the reports. The grafana dashboards here will not replace the CIS dashboard but the additional benefit of grafana is to have a customizable overview on hundreds or even thousends of VMs, containers, etc. The first approach is figure 1 which can easily be adopted to other needs.
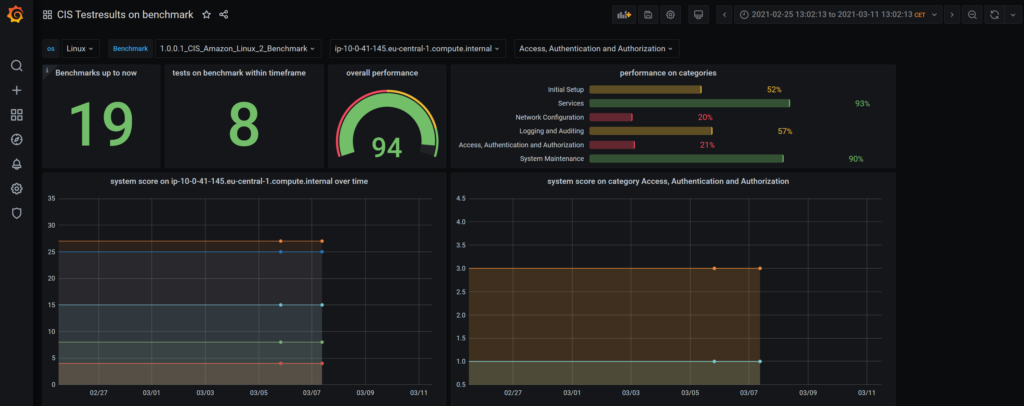
figure 1: dashboard first usable draft
The minimal requirement is to have an immediate impression of the overall status, the number of tests, which were performed, the scores achieved and to be able to dig into the systems level. Entry points are the benchmark types as well as the enterprise architecture. The grafana way to realize this is by dashboard variables that show up as dropdown lists in the header of the dashboards. ,These variables have a hierarchy, first you choose between linux and windows objects, then among the available benchmarks, the systems which were tested according to these benachmarks etc.
Below we have the big numbers: tests performed in total, tests per timespan choosen in the upper right corner, the overall status. Then you can drill down by choosing benchmarks, systems and categories, good enough to monitor the “continous improvement process”.
So what do we have to do?
Step1: decision where do we get the data from?
Step2: create a mechanism to import the reports in to the database
Step3: install grafana
Step4: create the dashboards
You can find all resources on github so I will just document the design decisions.
Step 1: where do we get the data from?
The Assessor uses a generic data model which is hardly understandable.We can deduce the benchmarks, the main scores and some further data that we could use. I started with this approach and there are code snippets for a dashboard on github if you want to continue this way. The downside is that we are not allowed to make any changes on the data model and the queries get very complicated for what we want to do. So the approach was to parse the generated reports because they are easy to understand and put them in a separate schema of the mysql database.
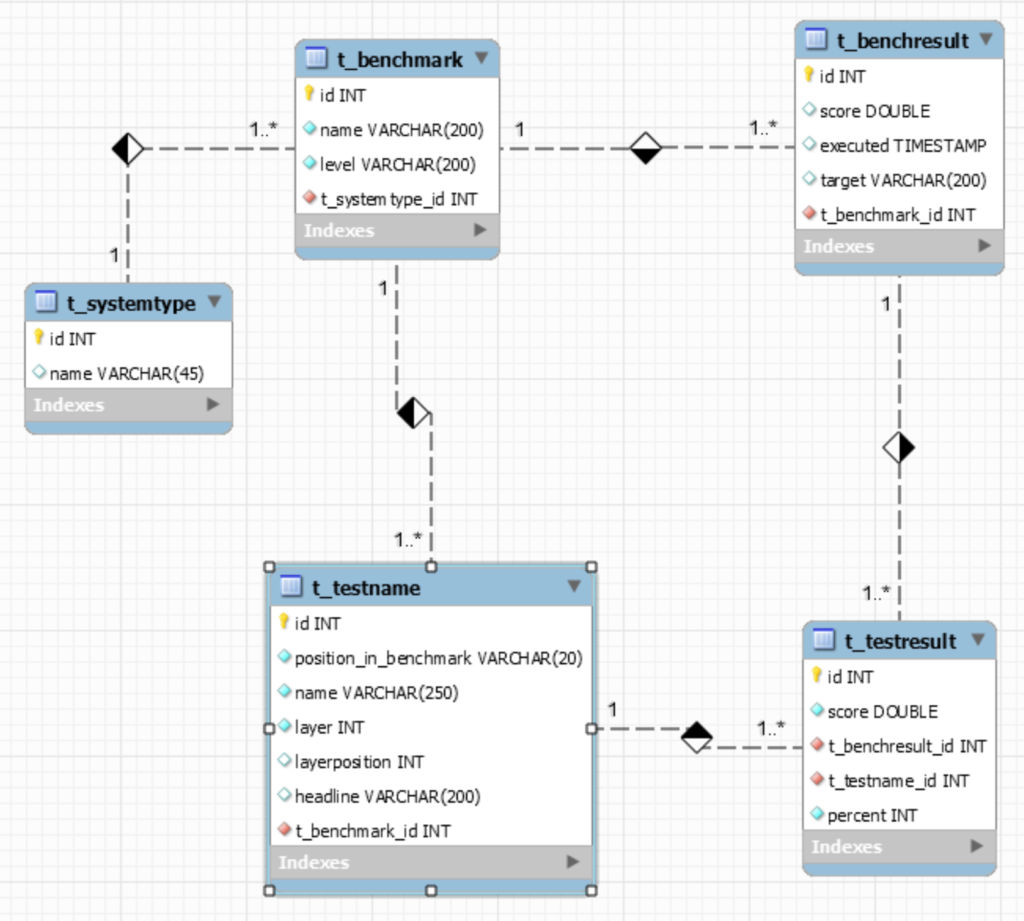
figure 2: ER rmodel of grafdb
We have the t_benchmark table which contains the “definition” of a benchmark. Each benchmark consists of n single tests, stored in table t_testname, with an understandable “headline” and a technical “name”. There is a hierarchy among tests which is managed by attributes “layer” and “layerposition”. On the right side we see tables t_benchresult each with n t_testresults which represent the performed tests and their results. Pretty simple and a base for all kinds of diagrams.
The model is created by the MySQL Workbench. The forward engineering mechanism is used to create the database instance called “grafdb”. The database user has to get the right to access the database from the jump host as well the host where grafana is running.
Step2: create a mechanism to import the reports in to the database
The Assessor is controlled by config files and crontab entries, so it suits to have a python skript to parse the reports and put them in the db. Please find it on github.
[ec2-user@ip-10-0-41-145 python]$ python3.8 pmtest.py -h
pmtest.py -p  -h -d  -u  -s
The code is straight forward: the
def import_reports(path):
reads all *.html files from the given directory “path”.
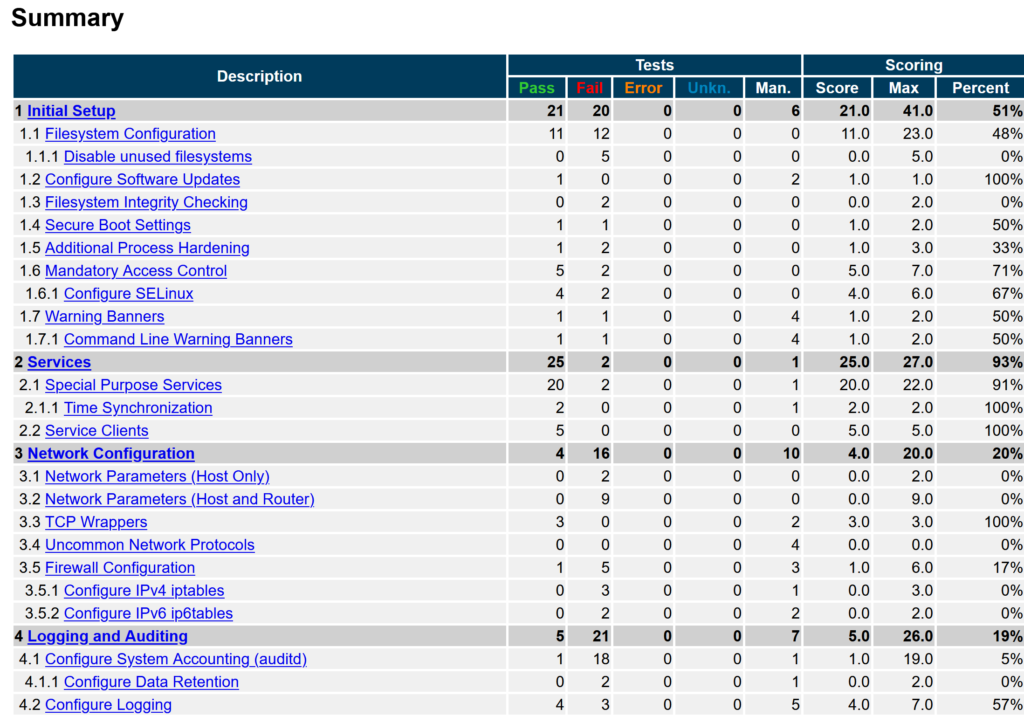
figure 3: Test summary
Each report contains the summary -see figure 3- which is parsed by
def read_report(file):
which extracts the meta_information target machine, benchmark-type, testtime etc. These data are stored in a structure
test_result = {'title': "", 'category': "", 'time': "", 'level': "", 'target': "0.0.0.0", 'results': []}
and later inserted into the database by
def store(test_result):
Not all reports follow exactly the structure so we have minimal adjustments per benchmark.
Step3: install python, grafana
We start with the Amazon Linux 2 image used for the Assessor. We need a recent MySQL driver and the matching python version. The following snippets from my history show the necessary steps..
[ec2-user@ip-10-0-41-145 ~]$ history
1 sudo yum update
2 amazon-linux-extras | grep -i python
380 sudo amazon-linux-extras enable python3.8
381 yum clean metadata
383 sudo yum install python38
384 python -V
385 python3.8 -V
411 yum search pip
412 sudo yum install python38-pip.noarch
417 sudo pip3.8 install mysql-connector
418 sudo pip3.8 install mysql-connector-python
426 mysql -u root -p
[create user ‘grafdb’@’your-ip-address’ identified by ‘anotherComplexPassword’;]
427 mysql -u grafdb -p
450 vi pmtest.py
451 python3.8 pmtest.py -p ../Assessor-CLI/reports
// revert the renamed reports during developement
453 for file in ../Assessor-CLI/reports/*.htmlimp; do mv “$file” “${file/.htmlimp/.html}”; done;
For grafana there are helpfull step by step guides, i.e. here.
Step 4: create the dashboards
We have two dashboards: one based on the CCPD database, which is part of the Assessor itself and the other which is a rather stable base for further improvements based on the grafdb database in Step 1.
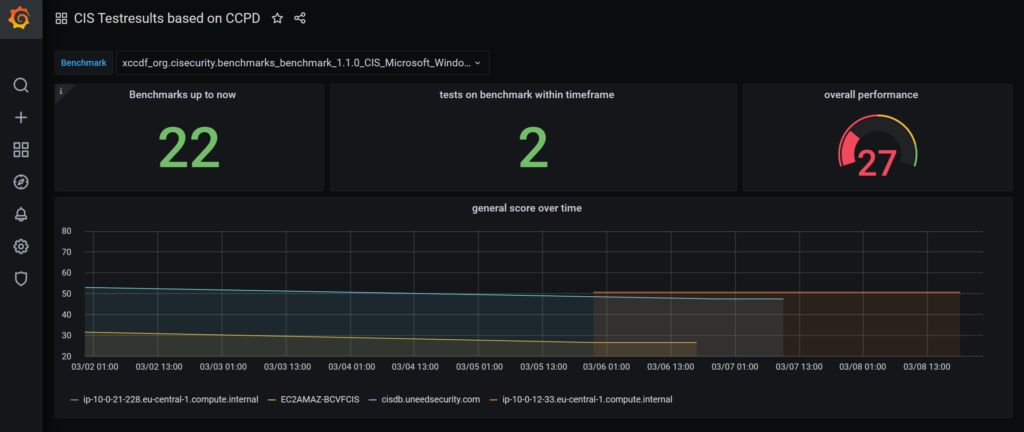
figure 5 CCPD based dashboard
The dashboard variables
Benchmark defined by
SELECT identifier from benchmark;
The Panels
- Benchmarks up to now
SELECT
id
FROM test_result
- tests on benchmark within timeframe
SELECT
count(tr.id)
FROM test_result tr JOIN system_identifier ti ON tr.target_system_id=ti.target_system_id and ti.type_id=1426
JOIN benchmark b ON tr.benchmark_id=b.id and b.identifier IN ($Benchmark)
WHERE
$__timeFilter(start_time)
- overall performance
SELECT
tr.start_time as "time",
avg(tr.score_dbl) as "score",
ti.value as metric
FROM test_result tr JOIN system_identifier ti ON tr.target_system_id=ti.target_system_id and ti.type_id=1426
JOIN benchmark b ON tr.benchmark_id=b.id and b.identifier IN ($Benchmark)
WHERE
$__timeFilter(tr.start_time)
group by ti.value,1
order by time
- general score over time
SELECT
tr.start_time as "time",
avg(tr.score_dbl) as "score",
ti.value as metric
from test_result tr JOIN system_identifier ti ON tr.target_system_id=ti.target_system_id and ti.type_id=1426
group by ti.value,1
order by time
This gives a general overview on the status, but lacks possibility to dig into the system or benchmark layer. Lets have a look on the second dashboard, based on the grafdb.
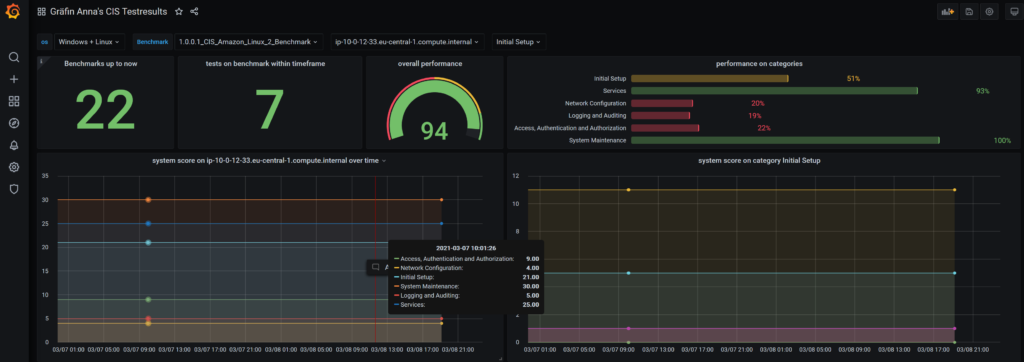
figure 6: proposed dashboard with overview and specific details
We have chained variables:
| os | select name from t_systemtype |
| Benchmark | select bm.name from t_benchmark bm JOIN t_systemtype type ON bm.t_systemtype_id=type.id and type.name IN ($os) |
| system | select br.target from t_benchresult br JOIN t_benchmark bm ON br.t_benchmark_id=bm.id and bm.name IN ($Benchmark) |
| testcategory | select distinct tn.headline from t_testresult tr JOIN t_benchresult br ON tr.t_benchresult_id=br.id JOIN t_testname tn ON tr.t_testname_id=tn.id where tn.layer=0 AND br.target=”$system” |
| category_layer1 | select distinct tn.position_in_benchmark from t_testresult tr JOIN t_benchresult br ON tr.t_benchresult_id=br.id and br.target=”$system” JOIN t_testname tn ON tr.t_testname_id=tn.id where tn.layer=0 and tn.headline=”$testcategory” |
| lasttestid | select max(br.id) from t_benchresult br where br.target=”$system” |
The Panels
- Benchmarks up to now
SELECT id
FROM t_benchresult
- tests on benchmark within timeframe
SELECT
count(tr.id)
FROM t_benchresult tr JOIN t_benchmark bm ON tr.t_benchmark_id=bm.id and bm.name IN ($Benchmark)
WHERE
$__timeFilter(tr.executed)
- overall performance (gauge)
SELECT
br.executed as "time",
avg(br.score) as "score",
bm.name as metric
from t_benchresult br JOIN t_benchmark bm ON br.t_benchmark_id=bm.id and bm.name IN ($Benchmark)
where
$__timeFilter(br.executed)
group by bm.name,1
order by time
- performance on categories (bar gauge)
SELECT distinct
tr.percent as "score",
tn.headline as metric
from t_testresult tr JOIN t_benchresult br ON tr.t_benchresult_id=br.id and br.target="$system"
JOIN t_testname tn ON tr.t_testname_id=tn.id
where tn.layer=0 and br.id="$lasttestid"
- system score on $system over time
SELECT
br.executed as "time",
avg(tr.score) as "score",
tn.headline as metric
from t_testresult tr JOIN t_benchresult br ON tr.t_benchresult_id=br.id and br.target="$system"
JOIN t_testname tn ON tr.t_testname_id=tn.id
where tn.layer=0
group by tn.headline,1
order by time
- system score on category $testcategory
SELECT
br.executed as "time",
avg(tr.score) as "score",
tn.headline as metric
from t_testresult tr JOIN t_benchresult br ON tr.t_benchresult_id=br.id and br.target="$system"
JOIN t_testname tn ON tr.t_testname_id=tn.id
where tn.layer=1 AND tn.position_in_benchmark like "$category_layer1%"
group by tn.headline,1
order by time
The bar gauge is rather tricky. To show the “headline” attribute near the bar we need to specify $__cell_1 as the display name.

figure 7: field options for bar gauge panel
The queries are best formed within the SQL Editor. Very simple queries could be created with help of the grafana Query Builder. It is much a try and error thing, the grafana log file /var/log/grafana/grafana.log contains every sql error in detail. Some effects are not clear, please have a look at the following panel “tests on benchmark within timeframe“
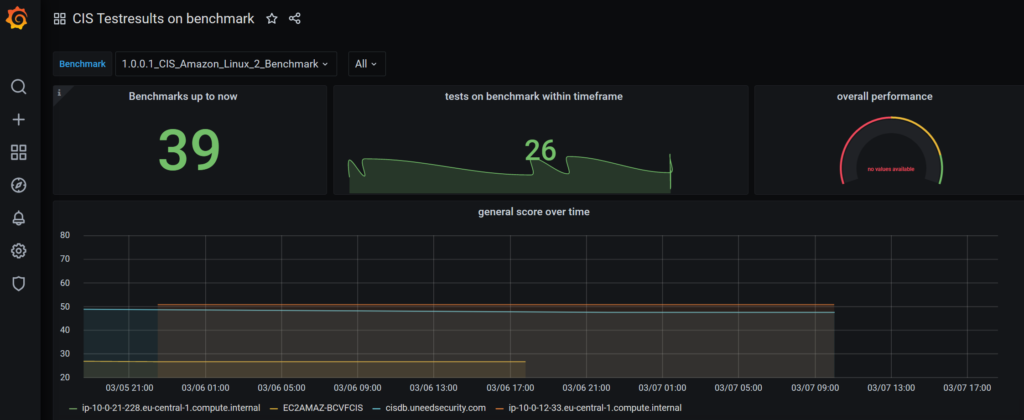
figure 8: effect on upper middle panel
Discussion
We have seen that the monitoring of our “continous improvement process” can be done by grafana. It is quite comfortable for developers and could be easy to adopt the next requirement. For the less experienced the creation of sql queries is rather error prone.